This model shows the impact of renewables on the electric grid. The sensors show how the voltage per unit fluctuates depending on the building load and the power produced by the PV and the wind turbine. To the right of the model is the post-processing that computes the ratio of energy produced by the renewables over the energy consumed by the loads.
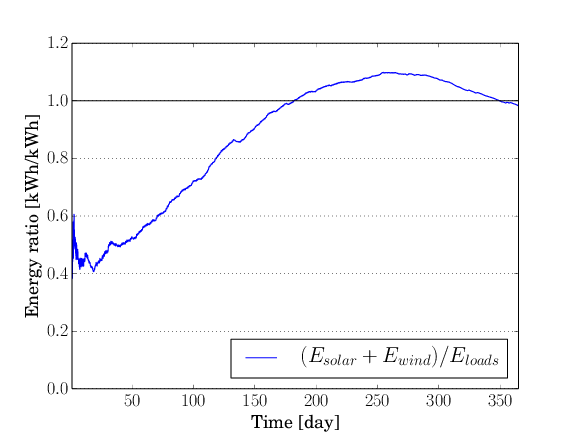
Th image below shows the ratio between the energy produced by renewable energy sources over the energy consumed by the loads over one year. The solid line indicates the Net-Zero Energy goal and the blue line indicates the actual ratio for the neighborhood represented by the model.
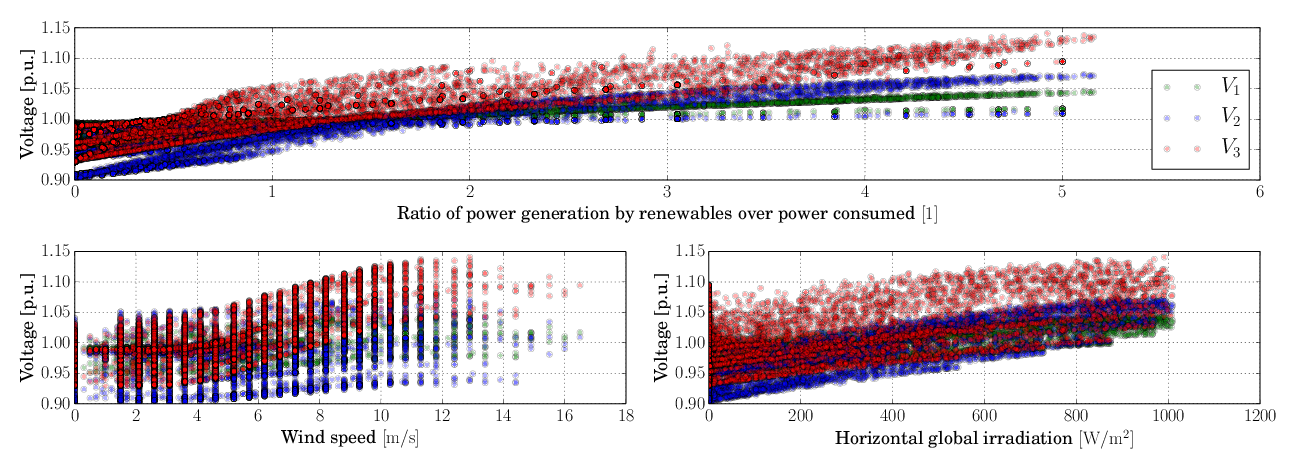
The scatter plots show the voltage levels at different locations in the network. In particular, the plots highlight how the voltage fluctuations are related to the power generated by the renewable sources, to the wind speed and the global horizontal irradiation. As expected, voltage increases with the power generated by the renewables, causing possible instabilities to the electrical grid.
lat as this is now
obtained from the weather data reader.loa1.y outside of a
connect statement.