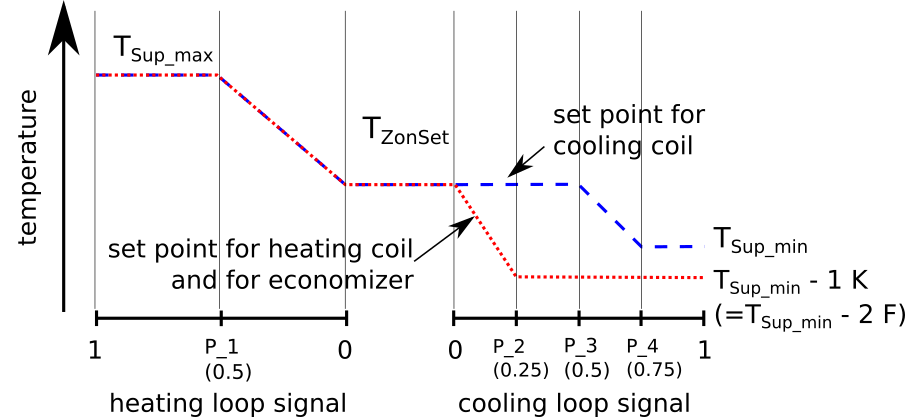
This example demonstrates how to create a scatter plot that
shows for a single zone VAV control logic the heating and cooling
set point temperatures, and the fan speed, all as a function of the
heating and cooling control signal. The sequence that will be used
to plot the sequence diagram is
Buildings.Controls.OBC.ASHRAE.G36.AHUs.SingleZone.VAV.SetPoints.Supply
and shown below. The plot will be generated in the file
plots.html.