The package Buildings.Utilities.Plotters consists
of models that generate time series plots or scatter plots, and
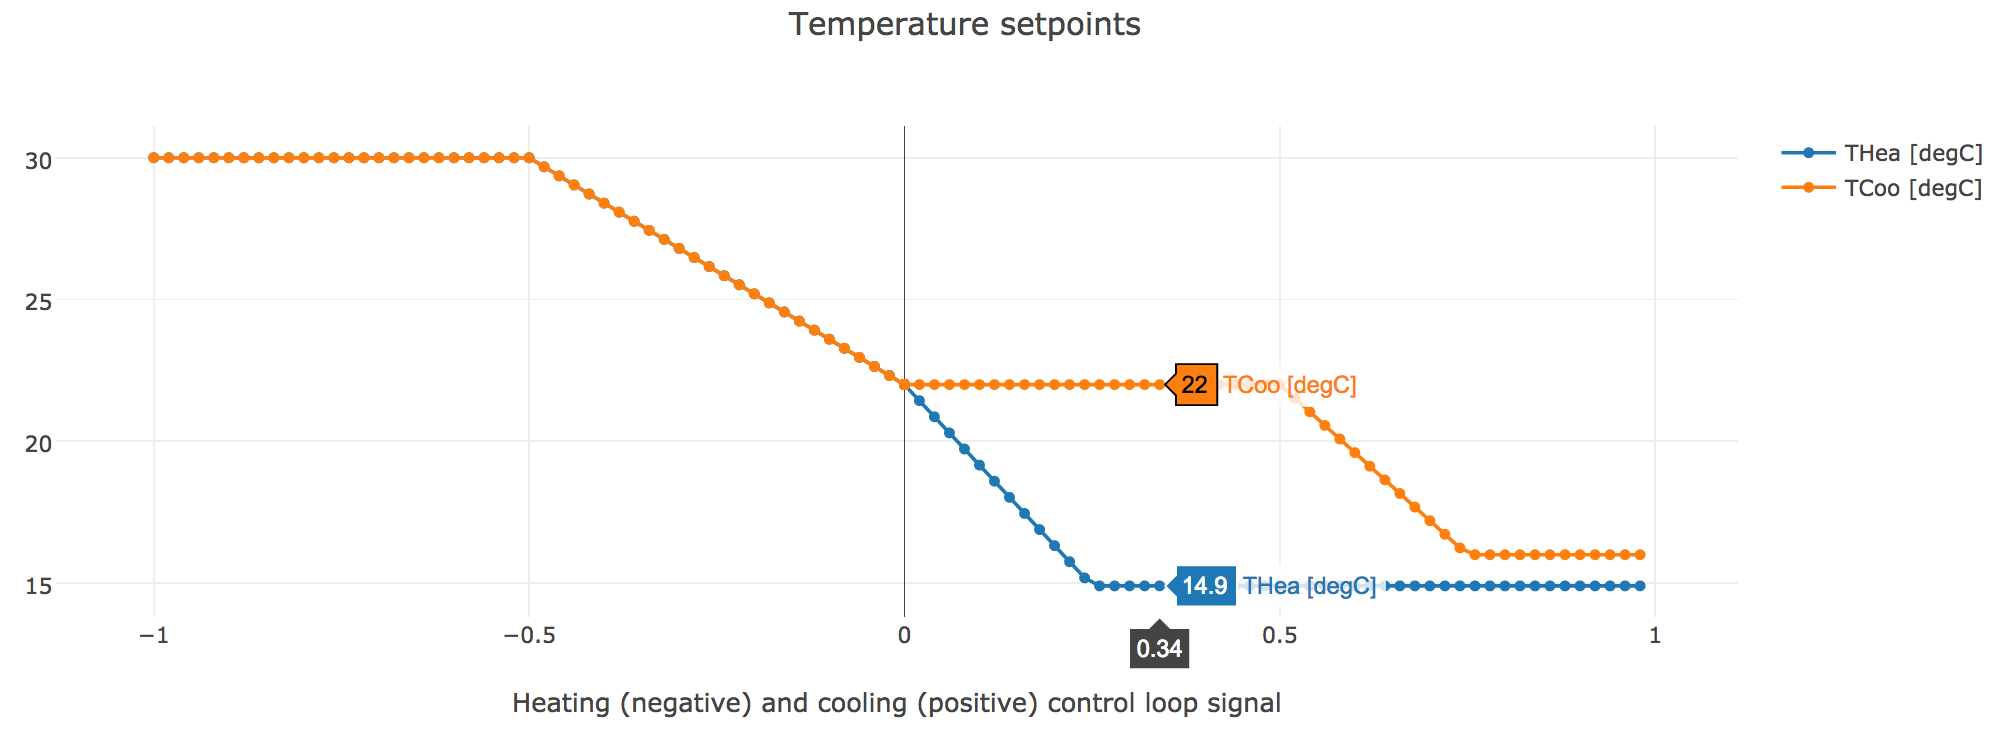
save them in one or multiple html files. The plotters allow for
example to plot control sequences such as the one shown below,
which was generated from
Buildings.Utilities.Plotters.Examples.SingleZoneVAVSupply_u.
First, drag at the top-level of the model an instance of
Buildings.Utilities.Plotters.Configuration
and enter a value for its samplePeriod, which is the
frequency with which data will be written to the plots. This global
configuration block is required for the plotters to work. This
global configuration block also allows to specify other optional
global configurations that are by default used by all plotter
instances.
Next, to create time series or scatter plots, drag as many instances of Buildings.Utilities.Plotters.TimeSeries or Buildings.Utilities.Plotters.Scatter and connect them to the signals that you like to plot.
By default, all plots will be written to the file
plots.html. This file name can be changed with the
parameter fileName, either globally for all plots in
the instance Buildings.Utilities.Plotters.Configuration,
or for individual plotters in the respective instance. Similarly,
the sampling time, which is specified globally in Buildings.Utilities.Plotters.Configuration,
can be overwritten by each block.
For some plots such as for control signals, it makes sense to
only plot the data when the HVAC system is operating. To allow
this, the global configuration block, as well as each individual
plotter instance, allows to enable a boolean input port called
activate. Through the parameter
activation, this boolean input port can be enabled or
disabled. If enabled, then the plotter is activated if the signal
at this port is true. If it is false,
then no data will be sampled. By default, the plotters inherit the
activation from the global configuration.
Moreover, it may make sense to not plot data in the first few
minutes after the HVAC system has been switched on. For example,
one may only want to plot the mixed air temperature at an
economizer 2 minutes after the HVAC system has been switched
on. To support this, the parameter activationDelay can
be set. For example, if activationDelay=120 seconds,
then data will be collected for plotting only 120 seconds
after activate becomes true. As with the
other parameters, the plotters inherit by default the
activationDelay from the global configuration, but
this value can locally be overwritten. A local overwrite allows for
example in an HVAC system to not plot the mixed air temperature for
2 minutes and not plot the room air temperature for
30 minutes after the system has been switched on.
Various examples that illustrate the use of the plotters can be found in Buildings.Utilities.Plotters.Examples.
The plotters write an html file with JavaScript that uses the plotly library to render the plots.