
modelClientLBNL90
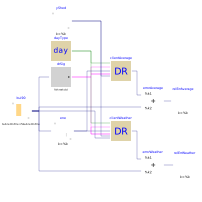
Demand response client with input data from building 90 at LBNL
Extends from Modelica.Icons.Example (Icon for runnable examples).
Information
Model that demonstrates the demand response client, using as an input for the actual electrical consumption simulated data from building 90 at LBNL. Output of the data reader are the outdoor dry-bulb temperature, the total electrical consumption, and a signal that indicates whether load shedding is required.
Output of the demand response blocks are the predicted power consumption.
If the input signal shed is true,
then the predicted load is reduced by the amount of power that is shed,
as received from the input signal yShed.
Parameters
| Type | Name | Default | Description |
|---|---|---|---|
| Integer | nSam | 24*4 | Number of samples in a day |
Components
| Type | Name | Default | Description |
|---|---|---|---|
| Client | clientAverage | Demand response client | |
| Sources.DayType | dayType | Outputs the type of the day | |
| Modelica.Blocks.Sources.CombiTimeTable | bui90 | LBNL building 90 data | |
| Modelica.Blocks.Logical.GreaterThreshold | drSig | Demand response signal | |
| Modelica.Blocks.Math.Add | errorAverage | Difference between predicted minus actual load | |
| Client | clientWeather | Demand response client with weather regression model | |
| Modelica.Blocks.Math.Add | errorWeather | Difference between predicted minus actual load | |
| Modelica.Blocks.Math.Gain | relErrAverage | Relative error, normalized by a value that is close to the peak power consumption | |
| Modelica.Blocks.Math.Gain | relErrWeather | Relative error, normalized by a value that is close to the peak power consumption | |
| Modelica.Blocks.Continuous.Integrator | ene | Integrator to compute energy from power | |
| Modelica.Blocks.Sources.Constant | yShed | Amount of load to be shed during DR event |
Revisions
-
April 21, 2016, by Michael Wetter:
ReplacedModelicaServices.ExternalReferences.loadResourcewithModelica.Utilities.Files.loadResource. -
March 20, 2014 by Michael Wetter:
First implementation.