
modelBoilerTableEfficiencyCurves
Boilers with efficiency curves specified by look-up table
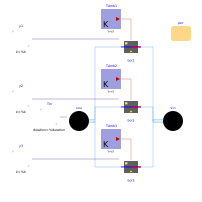
Extends from Modelica.Icons.Example (Icon for runnable examples).
Information
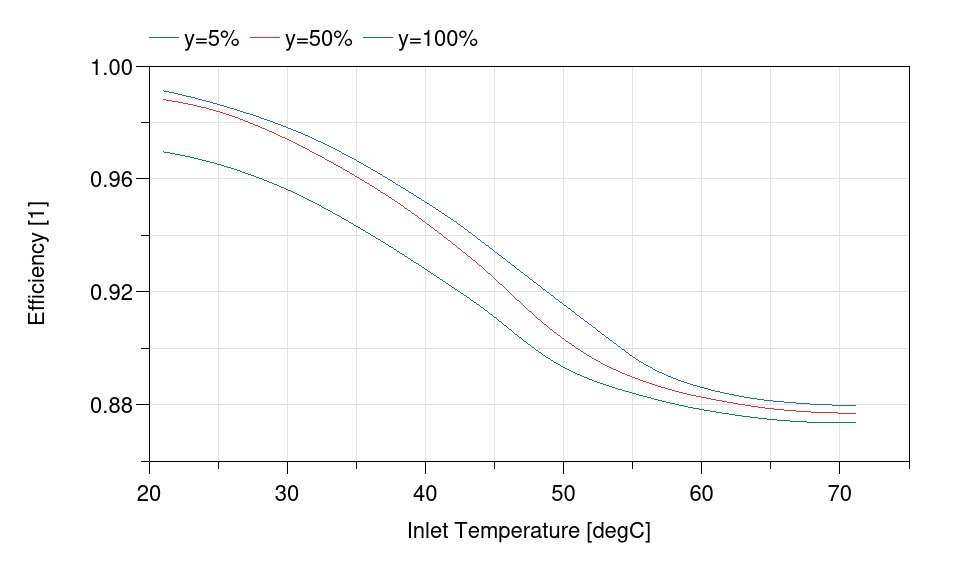
This model computes the efficiency of boilers for using the model Buildings.Fluid.Boilers.BoilerTable at firing rates of 5%, 50%, and 100%.
The models are configured to compute the following efficiency curves.
Parameters
| Type | Name | Default | Description |
|---|---|---|---|
| Buildings.Fluid.Boilers.Data.Lochinvar.Crest.FBdash2501 | per | Record containing a table that describes the efficiency curves |
Components
| Type | Name | Default | Description |
|---|---|---|---|
| Buildings.Fluid.Sources.Boundary_pT | sin | Sink | |
| Buildings.Fluid.Sources.Boundary_pT | sou | Source | |
| Buildings.Fluid.Boilers.BoilerTable | boi1 | Boiler 1 set at 5% firing rate | |
| Buildings.HeatTransfer.Sources.FixedTemperature | TAmb1 | Ambient temperature in boiler room | |
| Buildings.Fluid.Boilers.BoilerTable | boi2 | Boiler 2 set at 50% firing rate | |
| Buildings.HeatTransfer.Sources.FixedTemperature | TAmb2 | Ambient temperature in boiler room | |
| Buildings.Fluid.Boilers.BoilerTable | boi3 | Boiler 3 set at 100% firing rate | |
| HeatTransfer.Sources.FixedTemperature | TAmb3 | Ambient temperature in boiler room | |
| Modelica.Blocks.Sources.Constant | y1 | Setting the firing rate at constant 5% | |
| Modelica.Blocks.Sources.Constant | y2 | Setting the firing rate at constant 50% | |
| Modelica.Blocks.Sources.Constant | y3 | Setting the firing rate at constant 100% | |
| Modelica.Blocks.Sources.Ramp | TIn | Ramps the T_inlet from the first to the last temperature provided by the efficiency curve table |
Contents
| Name | Description |
|---|---|
 Medium Medium | Medium model |
Revisions
-
October 13, 2021, by Hongxiang Fu:
First implementation. This is for #2651.