
modelTimeSeries
Simple time series plots
Extends from Modelica.Icons.Example (Icon for runnable examples).
Information
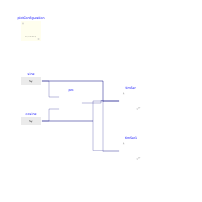
This example demonstrates the use of a plotter
that plots (t, sin(t), cos(t), sin(t)*cos(t)) in
one plot, and
(t, sin(t), cos(t))
in another plot.
Both plots will be in the file specified
in the plot configuration plotConfiguration.
Components
| Type | Name | Default | Description |
|---|---|---|---|
| Buildings.Utilities.Plotters.Configuration | plotConfiguration | Configuration for the plotters | |
| Buildings.Utilities.Plotters.TimeSeries | timSer | Plotter | |
| Modelica.Blocks.Sources.RealExpression | sine | Sine output signal | |
| Modelica.Blocks.Sources.RealExpression | cosine | Cosine output signal | |
| Buildings.Utilities.Plotters.TimeSeries | timSer1 | Plotter | |
| Modelica.Blocks.Math.Product | pro | Product of sine times cosine |
Revisions
-
March 6, 2023, by Michael Wetter:
Added a constant in order for unit check to pass.
See #1711 for a discussion. -
March 23, 2018, by Michael Wetter:
First implementation.