
modelSingleZoneResidentialHydronic
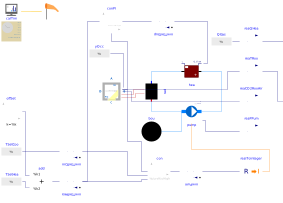
Extends from Modelica.Icons.Example (Icon for runnable examples).
Information
This is a single zone residential hydronic system model for WP 1.2 of IBPSA project 1.
Building Design and Use
Architecture
This building envelope model corresponds to the BESTEST case 900 test case. It consists of a single zone with a rectangular floor plan of 6 by 8 meters and a height of 2.7 m. The zone further consists of two south-oriented windows of 6 m2 each, which are modelled using a single window of 12 m2.
Constructions
The walls consist of 10 cm thick concrete blocks and 6 cm of foam insulation. For more details see IDEAS.Buildings.Validation.Data.Constructions.HeavyWall. The floor consists of 8 cm of concrete and 1 m of insulation, representing a perfectly insulated floor. The roof consists of a light construction and 11 cm of fibreglass.
Occupancy schedules
The zone is occupied by one person before 7 am and after 8 pm each weekday and full time during weekends.
Internal loads and schedules
There are no internal loads other than the occupants.
Climate data
The model uses a climate file containing one year of weather data for Brussels, Belgium.
HVAC System Design
Primary and secondary system designs
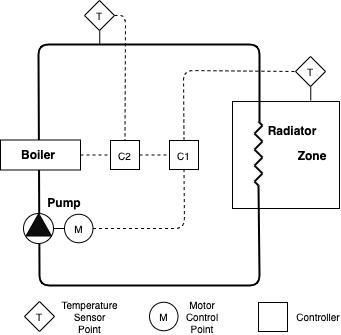
The model only has a primary heating system that heats the zone using a single radiator with thermostatic valve, a circulation pump and a water heater. The system is presented in Figure 1 below. The radiator nominal thermal power and heater maximum thermal power is 5 kW. The heating setpoint is set to 21 °C during occupied periods and 15 °C during unoccupied periods. The cooling setpoint is set to 24 °C during occupied peridos and 30 °C during unoccupied periods. The gas heater efficiency is computed using a polynomial curve and it uses a PI controller to modulate supply water temperature between 20 and 80 °C to track a reference for the operative zone temperature that equals the heating setpoint plus an offset of 0.1 °C by default.
Equipment specifications and performance maps
The heating system circulation pump has the default efficiency of the pump model, which is 49%; at the time of writing. The heater efficiency is computed using a polynomial curve.
Rule-based or local-loop controllers (if included)
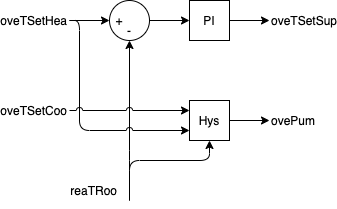
The model assumes a pump with a constant head, which results in a fixed flow rate due to the fixed pressure drop coefficient of the radiator. The supply water temperature set point of the boiler is modulated using a PI controller that tracks zone operative temperature to follow the zone operative temperature setpoint, depicted as controller C1 in Figure 1 and shown in Figure 2 below. For baseline control, this setpoint is defined as the heating comfort setpoint plus an offset of 0.1 °C. The pump is switched on and off with hysteresis based on the indoor temperature with the heating set point as the low point and the cooling set point as the high point. It is assumed that the boiler exactly outputs the supply water temperature set point using an ideal controller depicted as C2 in Figure 1.
Model IO's
Inputs
The model inputs are:
-
oveTSetHea_u[K] [min=288.15, max=296.15]: Zone operative temperature setpoint for heating -
oveTSetCoo_u[K] [min=296.15, max=303.15]: Zone operative temperature setpoint for cooling -
oveTSetSup_u[K] [min=293.15, max=353.15]: Supply temperature setpoint of the heater -
ovePum_u[1] [min=0.0, max=1.0]: Integer signal to control the stage of the pump either on or off
Outputs
The model outputs are:
-
reaQHea_y[W] [min=None, max=None]: Heating thermal power -
reaPPum_y[W] [min=None, max=None]: Pump electrical power -
reaCO2RooAir_y[ppm] [min=None, max=None]: CO2 concentration in the zone -
reaTRoo_y[K] [min=None, max=None]: Operative zone temperature -
weaSta_reaWeaPAtm_y[Pa] [min=None, max=None]: Atmospheric pressure measurement -
weaSta_reaWeaHGloHor_y[W/m2] [min=None, max=None]: Global horizontal solar irradiation measurement -
weaSta_reaWeaNOpa_y[1] [min=None, max=None]: Opaque sky cover measurement -
weaSta_reaWeaTBlaSky_y[K] [min=None, max=None]: Black-body sky temperature measurement -
weaSta_reaWeaNTot_y[1] [min=None, max=None]: Sky cover measurement -
weaSta_reaWeaSolAlt_y[rad] [min=None, max=None]: Solar altitude angle measurement -
weaSta_reaWeaSolZen_y[rad] [min=None, max=None]: Solar zenith angle measurement -
weaSta_reaWeaHHorIR_y[W/m2] [min=None, max=None]: Horizontal infrared irradiation measurement -
weaSta_reaWeaSolTim_y[s] [min=None, max=None]: Solar time -
weaSta_reaWeaCloTim_y[s] [min=None, max=None]: Day number with units of seconds -
weaSta_reaWeaLon_y[rad] [min=None, max=None]: Longitude of the location -
weaSta_reaWeaRelHum_y[1] [min=None, max=None]: Outside relative humidity measurement -
weaSta_reaWeaSolDec_y[rad] [min=None, max=None]: Solar declination angle measurement -
weaSta_reaWeaHDirNor_y[W/m2] [min=None, max=None]: Direct normal radiation measurement -
weaSta_reaWeaWinDir_y[rad] [min=None, max=None]: Wind direction measurement -
weaSta_reaWeaTWetBul_y[K] [min=None, max=None]: Wet bulb temperature measurement -
weaSta_reaWeaTDewPoi_y[K] [min=None, max=None]: Dew point temperature measurement -
weaSta_reaWeaWinSpe_y[m/s] [min=None, max=None]: Wind speed measurement -
weaSta_reaWeaHDifHor_y[W/m2] [min=None, max=None]: Horizontal diffuse solar radiation measurement -
weaSta_reaWeaLat_y[rad] [min=None, max=None]: Latitude of the location -
weaSta_reaWeaTDryBul_y[K] [min=None, max=None]: Outside drybulb temperature measurement -
weaSta_reaWeaCeiHei_y[m] [min=None, max=None]: Cloud cover ceiling height measurement -
weaSta_reaWeaSolHouAng_y[rad] [min=None, max=None]: Solar hour angle measurement
Additional System Design
Lighting
No lighting model is included.
Shading
No shading model is included.
Model Implementation Details
Moist vs. dry air
The model uses moist air despite that no condensation is modelled in any of the used components.
Pressure-flow models
A simple, single circulation loop is used to model the heating system.
Infiltration models
Fixed air infiltration corresponding to an n50 value of 10 is modelled.
Scenario Information
Time Periods
The Peak Heat Day (specifier for /scenario API is 'peak_heat_day') period is:
-
This testing time period is a two-week test with one-week warmup period utilizing
baseline control. The two-week period is centered on the day with the
maximum 15-minute system heating load in the year.
-
Start Time: Day 311.
-
End Time: Day 325.
The Typical Heat Day (specifier for /scenario API is 'typical_heat_day') period is:
-
This testing time period is a two-week test with one-week warmup period utilizing
baseline control. The two-week period is centered on the day with
the maximum 15-minute system heating load that is closest from below to the
median of all 15-minute maximum heating loads of all days in the year.
-
Start Time: Day 334.
-
End Time: Day 348.
Energy Pricing
All pricing scenarios include the same constant value for transmission fees and taxes of each commodity. The used value is the typical price that household users pay for the network, taxes and levies, as calculateed by Eurostat and obtained from: "The energy prices and costs in Europe report". For the assumed location of the test case, this value is of 0.20 EUR/kWh for electricity and of 0.03 EUR/kWh for gas.
The Constant Electricity Price (specifier for /scenario API is 'constant') profile is:
-
The constant electricity price scenario uses a constant price of 0.0535 EUR/kWh,
as obtained from the "Easy Indexed" deal for electricity (normal rate) in
https://www.energyprice.be/products-list/Engie
(accessed on June 2020).
Adding up the transmission fees and taxes, the final constant electricity price is
of 0.2535 EUR/kWh.
The Dynamic Electricity Price (specifier for /scenario API is 'dynamic') profile is:
-
The dynamic electricity price scenario uses a dual rate of 0.0666 EUR/kWh during
day time and 0.0383 EUR/kWh during night time,
as obtained from the "Easy Indexed" deal for electricity (dual rate) in
https://www.energyprice.be/products-list/Engie
(accessed on June 2020).
The on-peak daily period takes place between 7:00 a.m. and 10:00 p.m.
The off-peak daily period takes place between 10:00 p.m. and 7:00 a.m.
Adding up the transmission fees and taxes, the final dynamic electricity prices are
of 0.2666 EUR/kWh during on-peak periods and of 0.2383 during off-peak periods.
The Highly Dynamic Electricity Price (specifier for /scenario API is 'highly_dynamic') profile is:
-
The highly dynamic electricity price scenario is based on the the
Belgian day-ahead energy prices as determined by the BELPEX wholescale electricity
market in the year 2019.
Obtained from:
https://my.elexys.be/MarketInformation/SpotBelpex.aspx
Notice that the same constant transmission fees and taxes of 0.20 EUR/kWh are
added up on top of these prices.
-
The gas price is assumed constant and of 0.0198 EUR/kWh
as obtained from the "Easy Indexed" deal for gas
https://www.energyprice.be/products-list/Engie
(accessed on June 2020).
Adding up the transmission fees and taxes, the final constant gas price is
of 0.0498 EUR/kWh.
Emission Factors
The Electricity Emissions Factor profile is:
-
It is used a constant emission factor for electricity of 0.167 kgCO2/kWh
which is the grid electricity emission factor reported by the Association of Issuing Bodies (AIB)
for year 2018. For reference, see:
https://www.carbonfootprint.com/docs/2019_06_emissions_factors_sources_for_2019_electricity.pdf
The Gas Emissions Factor profile is:
-
Based on the kgCO2 emitted per amount of natural gas burned in terms of
energy content. It is 0.18108 kgCO2/kWh (53.07 kgCO2/milBTU).
For reference,
see:
https://www.eia.gov/environment/emissions/co2_vol_mass.php
Parameters
| Type | Name | Default | Description |
|---|---|---|---|
| Setpoints | |||
| Modelica.Units.SI.Temperature | TSetCooUno | 273.15 + 30 | Unoccupied cooling setpoint |
| Modelica.Units.SI.Temperature | TSetCooOcc | 273.15 + 24 | Occupied cooling setpoint |
| Modelica.Units.SI.Temperature | TSetHeaUno | 273.15 + 15 | Unoccupied heating setpoint |
| Modelica.Units.SI.Temperature | TSetHeaOcc | 273.15 + 21 | Occupied heating setpoint |
Connectors
| Type | Name | Default | Description |
|---|---|---|---|
| Modelica.Blocks.Interfaces.RealOutput | Q | Thermal power use of heater | |
| Modelica.Blocks.Interfaces.RealOutput | TZone | Zone operative temperature |
Components
| Type | Name | Default | Description |
|---|---|---|---|
| String | test | Modelica.Utilities.Files.loadResource("modelica://IDEAS/Resources/weatherdata/Uccle.TMY") | This is to ensure that the weather file is loaded when encapsulating this model into an FMU |
| IDEAS.BoundaryConditions.SimInfoManager | sim | Simulation information manager for climate data | |
| Modelica.Units.SI.Efficiency | eta | {-6.017763e-11, 2.130271e-8, -3.058709e-6, 2.266453e-4, -9.048470e-3, 1.805752e-1, -4.540036e-1}*{TCorr^(6 - i) for i in 0:6} | Boiler efficiency |
| Real | TCorr | min(max(pump.heatPort.T - 273.15, 25), 75) | Temperature within validity range of correlation |
| IDEAS.Buildings.Validation.Cases.Case900Template | case900Template | Case 900 BESTEST model | |
| IDEAS.Fluid.HeatExchangers.Radiators.RadiatorEN442_2 | rad | Radiator | |
| IDEAS.Fluid.HeatExchangers.Heater_T | hea | Ideal heater - pressure drop merged into radiator | |
| Fluid.Movers.FlowControlled_dp | pump | Hydronic pump | |
| IDEAS.Fluid.Sources.Boundary_pT | bou | Absolute pressure boundary | |
| Utilities.Time.CalendarTime | calTim | ||
| Modelica.Blocks.Sources.RealExpression | yOcc | Fixed schedule of 1 occupant between 7 am and 8 pm | |
| IDEAS.Utilities.IO.SignalExchange.Read | reaTRoo | Block for reading the operative zone temperature | |
| IDEAS.Utilities.IO.SignalExchange.Overwrite | oveTSetSup | Block for overwriting supply temperature control signal | |
| Modelica.Blocks.Sources.Constant | offSet | Offset above heating temperature setpoint to ensure comfort | |
| Utilities.IO.SignalExchange.Read | reaQHea | Block for outputting the thermal power | |
| Utilities.IO.SignalExchange.Read | reaPPum | Block for reading the pump electrical power | |
| Modelica.Blocks.Math.RealToInteger | realToInteger | ||
| Controls.Discrete.HysteresisRelease | con | Hysteresis controller for emission system | |
| Utilities.IO.SignalExchange.Overwrite | ovePum | Block for overwriting pump control signal | |
| Utilities.IO.SignalExchange.Read | reaCO2RooAir | Block for reading CO2 concentration in the zone | |
| Modelica.Blocks.Sources.RealExpression | QGas | Primary gas thermal power | |
| Utilities.IO.SignalExchange.Overwrite | oveTSetCoo | Overwrite for zone cooling setpoint | |
| Utilities.IO.SignalExchange.Overwrite | oveTSetHea | Overwrite for zone heating setpoint | |
| Modelica.Blocks.Sources.RealExpression | TSetCoo | Cooling temperature setpoint with setback | |
| Modelica.Blocks.Sources.RealExpression | TSetHea | Heating temperature setpoint with setback | |
| Modelica.Blocks.Continuous.LimPID | conPI | PI controller for the boiler supply water temperature | |
| Modelica.Blocks.Math.Add | add | ||
| Utilities.IO.SignalExchange.WeatherStation | weaSta | BOPTEST weather station |
Contents
| Name | Description |
|---|---|
 MediumWater MediumWater | Water medium |
 MediumAir MediumAir | Air medium |
Revisions
-
October 30, 2024, by Lucas Verleyen:
Updates according to IBPSA.
See #1383 (and IBPSA, #1926). -
December 2, 2021, by David Blum:
Remove read blocks for control signals. This is for BOPTEST issue #364. -
June 23, 2021, by David Blum:
Add schematics to documentation and move heating set point offset to before overwrite block. This is for #1220. -
April 22, 2021, by Javier Arroyo:
Add time period documentation. -
April 2, 2021 by Javier Arroyo
Add CO2 to air medium. -
February 22, 2021 by Javier Arroyo
Add transmission fees and taxes to pricing scenarios. -
December 1, 2020 by David Blum:
Added weather station. -
June 12, 2020 by Javier Arroyo:
Implemented PI controller for boiler supply temperature. -
June 2, 2020 by Javier Arroyo:
Implemented temperature setpoint setback. -
March 21, 2019 by Filip Jorissen:
Revised implementation based on first review for #996. -
January 22nd, 2019 by Filip Jorissen:
Revised implementation by adding external inputs. -
May 2, 2018 by Filip Jorissen:
First implementation.