
modelDensities
Demonstrates how to compute distribution densities (= Probability Density Function)
Extends from Modelica.Icons.Example (Icon for runnable examples).
Information
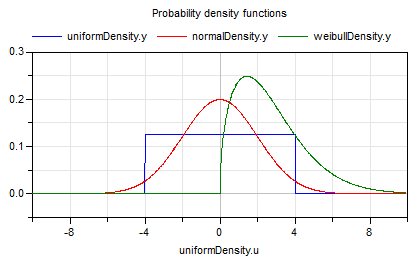
This example demonstrates how to compute the probability density functions (pdfs) of various distributions. In the following diagram simulations results for the uniform, normal, and Weibull distribution are shown. The outputs of the blocks are the pdfs that are plotted over one of the inputs:
Components
| Type | Name | Default | Description |
|---|---|---|---|
| Real | uniformDensity_y | uniformDensity.y | |
| Real | normalDensity_y | normalDensity.y | |
| Real | weibullDensity_y | weibullDensity.y | |
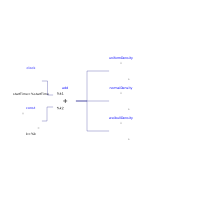
| Utilities.UniformDensity | uniformDensity | ||
| Modelica.Blocks.Sources.ContinuousClock | clock | ||
| Modelica.Blocks.Sources.Constant | const | ||
| Modelica.Blocks.Math.Add | add | ||
| Utilities.NormalDensity | normalDensity | ||
| Utilities.WeibullDensity | weibullDensity |
Revisions
| Date | Description | ||
|---|---|---|---|
| June 22, 2015 |
|
