
modelPsychrometricData
Extends from Modelica.Icons.Example (Icon for runnable examples).
Information
This model produces psychrometric data from the moist air model in this library to be plotted in charts. The two most common chart varieties are the Mollier Diagram and the Psychrometric Chart. The first is widely used in some European countries while the second is more common in the Anglo-American world. Specific enthalpy is plotted over absolute humidity in the Mollier Diagram, it is the other way round in the Psychrometric Chart.
It must be noted that the relationship of both axis variables is not right-angled, the absolute humidity follows a slope which equals the enthalpy of vaporization at 0 °C. For better reading and in order to reduce the fog region the humidity axis is rotated to obtain a right-angled plot. Both charts usually contain additional information as isochores or auxiliary scales for e.g., heat ratios. Those information are omitted in this model and the charts below. Other important features of psychrometric chart data are that all mass specific variables (like absolute humidity, specific enthalpy etc.) are expressed in terms of kg dry air and that their baseline of 0 enthalpy is found at 0 °C and zero humidity.
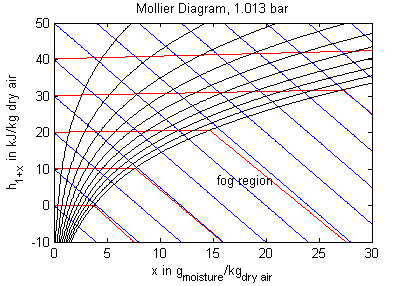
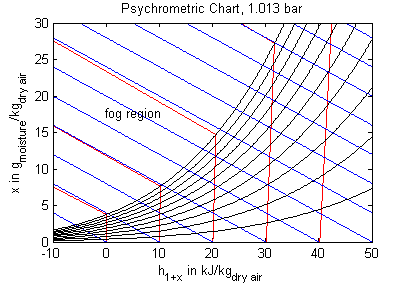
Legend: blue - constant specific enthalpy, red - constant temperature, black - constant relative humidity
The model provides data for lines of constant specific enthalpy, temperature and relative humidity in a Mollier Diagram or Psychrometric Chart as they were used for the figures above. For limitations and ranges of validity please refer to the MoistAir package description. Absolute humidity x is increased with time in this model. The specific enthalpies adjusted for plotting are then obtained from:
- y_h: constant specific enthalpy
- y_T: constant temperature
- y_phi: constant relative humidity
Parameters
| Type | Name | Default | Description |
|---|---|---|---|
| SI.Pressure | p_const | 1e5 | Pressure |
| Integer | n_T | 11 | Number of isotherms |
| SI.Temperature | T_min | 253.15 | Lowest isotherm |
| SI.Temperature | T_step | 10 | Temperature step between two isotherms |
| Integer | n_h | 16 | Number of lines with constant specific enthalpy |
| SI.SpecificEnthalpy | h_min | -20e3 | Lowest line of constant enthalpy |
| SI.SpecificEnthalpy | h_step | 1e4 | Enthalpy step between two lines of constant enthalpy |
| Integer | n_phi | 10 | Number of lines with constant relative humidity |
| Real | phi_min | 0.1 | Lowest line of constant humidity |
| Real | phi_step | 0.1 | Step between two lines of constant humidity |
| SI.MassFraction | x_min | 0.00 | Minimum diagram absolute humidity |
| SI.MassFraction | x_max | 0.03 | Maximum diagram absolute humidity |
| SI.Time | t | 1 | Simulation time |
| SI.Temperature | T_const | {T_min - T_step + i*T_step for i in 1:n_T} | Constant temperatures |
| SI.SpecificEnthalpy | h_const | {(i - 1)*h_step + h_min for i in 1:n_h} | Constant enthalpies |
| Real | phi_const | {(i - 1)*phi_step + phi_min for i in 1:n_phi} | Constant relative humidities |
| Real | diagSlope | Medium.enthalpyOfVaporization(273.15) | Rotation of diagram that zero degrees isotherm becomes horizontal outside the fog region |
| SI.MassFraction | x_start | x_min | Initial absolute humidity in kg water/kg dry air |
Components
| Type | Name | Default | Description |
|---|---|---|---|
| SI.MassFraction | x | Absolute humidity in kg water/kg dry air | |
| SI.SpecificEnthalpy | hx_T | h_1+x for constant T | |
| SI.SpecificEnthalpy | hx_h | Constanst h_1+x | |
| SI.SpecificEnthalpy | hx_phi | h_1+x for constanst phi | |
| SI.SpecificEnthalpy | y_T | Chart enthalpy for constant T | |
| SI.SpecificEnthalpy | y_h | Chart enthalpy for constant h | |
| SI.SpecificEnthalpy | y_phi | Chart enthalpy for constant phi | |
| Medium.BaseProperties | medium_T | Medium properties for constant T | |
| Medium.BaseProperties | medium_phi | Medium properties for constant phi |
Contents
| Name | Description |
|---|---|
 Medium Medium | Used medium package |