StateSpace.Plot.bodeSISO(ss)
   or
StateSpace.Plot.bodeSISO(
  ss,
  iu,
  iy,
  nPoints,
  autoRange,
  f_min,
  f_max,
  magnitude=true,
  phase=true,
  defaultDiagram=Modelica_LinearSystems2.Internal.DefaultDiagramBodePlot(),
  device=Modelica_LinearSystems2.Utilities.Plot.Records.Device())
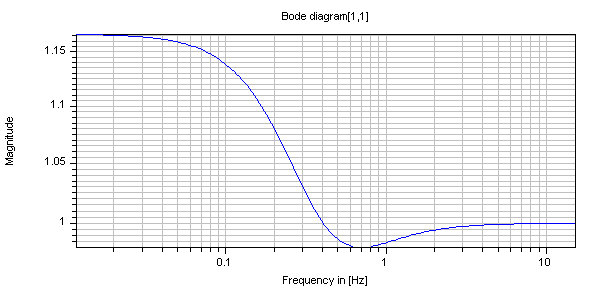
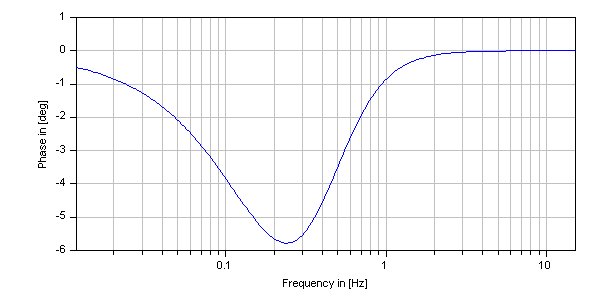
This function plots the bode-diagram of a transfer function corresponding to the behavior of the state space system from iu'th element of the input vector u to the iy'th element of the output vector y.
  Modelica_LinearSystems2.StateSpace ss=Modelica_LinearSystems2.StateSpace(
    A=[-1.0,0.0,0.0; 0.0,-2.0,0.0; 0.0,0.0,-3.0],
    B=[0.0,1.0; 1.0,1.0; -1.0,0.0],
    C=[0.0,1.0,1.0; 1.0,1.0,1.0],
    D=[1.0,0.0; 0.0,1.0])

  Integer iu=1;
  Integer iy=1;

algorithm
   Modelica_LinearSystems2.StateSpace.Plot.plotBodeSISO(ss, iu, iy)
//  gives:
encapsulated function bodeSISO
  import Modelica;
  import Modelica_LinearSystems2;
  import Modelica_LinearSystems2.StateSpace;
  import Modelica_LinearSystems2.Math;
  import Modelica_LinearSystems2.ZerosAndPoles;
  import Modelica_LinearSystems2.Internal;
  input StateSpace ss "State space system";
  input Integer iu = 1 "Index of input";
  input Integer iy = 1 "Index of output";
  input Integer nPoints(min = 2) = 200 "Number of points";
  input Boolean autoRange = true "= true, if abszissa range is automatically determined";
  input Modelica.Units.SI.Frequency f_min = 0.1 "Minimum frequency value, if autoRange = false";
  input Modelica.Units.SI.Frequency f_max = 10 "Maximum frequency value, if autoRange = false";
  input Boolean magnitude = true "= true, to plot magnitude" annotation(
    choices(checkBox = true));
  input Boolean phase = true "= true, to plot phase" annotation(
    choices(checkBox = true));
  input Real tol = 1e-10 "Tolerance of reduction procedure, default tol = 1e-10";
  extends Modelica_LinearSystems2.Internal.PartialPlotFunction(defaultDiagram = Modelica_LinearSystems2.Internal.DefaultDiagramBodePlot());
  input Boolean Hz = true "= true, to plot abszissa in [Hz], otherwise in [rad/s] (= 2*pi*Hz)" annotation(
    choices(checkBox = true));
  input Boolean dB = false "= true, to plot magnitude in [], otherwise in [dB] (=20*log10(value))" annotation(
    choices(checkBox = true),
    Dialog(enable = magnitude));
  input Boolean onFile = false "= true, if frequency response is stored on file as matrix [f,a,phi]" annotation(
    choices(checkBox = true));
  input String fileName = "frequencyResponse.mat" "If onFile=true, file on which the frequency response will be stored" annotation(
    Dialog(enable = onFile));
  input String matrixName = if Hz and not dB then "fHz_a_phiDeg" elseif Hz and dB then "fHz_adB_phiDeg"
   elseif not Hz and dB then "f_adB_phiDeg" else "f_a_phiDeg" "If onFile=true, Name of matrix on file" annotation(
    Dialog(enable = onFile));
end bodeSISO;