StateSpace.Plot.polesAndZeros(ss);
   or
StateSpace.Plot.polesAndZeros(
  ss,
  poles=true,
  zeros=true,
  print=true,
  defaultDiagram=Modelica_LinearSystems2.Internal.DefaultDiagramPolesAndZeros(),
  device=Modelica_LinearSystems2.Utilities.Plot.Records.Device());
This function plots a pole-zero-map of the poles and transmission zeros of a state space system. The poles are the eigenvalues of the system matrix (eigenvalues(ss.A)). The Boolean inputs "poles" and "zeros" define what to plot. If Boolean input "print = true", the results of the analysis are additionally printed in the textual format. The records "defaultDiagram" and "device" allow to set various layout options and the size and location of the diagram on the screen.
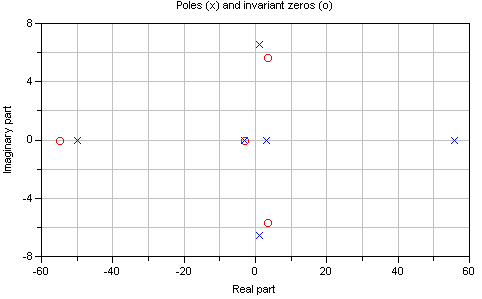
The example Modelica_LinearSystems2.Examples.StateSpace.plotPolesAndZeros is defined as
  Plot.polesAndZeros(ss = Modelica_LinearSystems2.StateSpace(
    A=[-3, 2,-3,  4, 5,6;
        0, 6, 7,  8, 9,4;
        0, 2, 3,  0,78,6;
        0, 1, 2,  2, 3,3;
        0,13,34,  0, 0,1;
        0, 0, 0,-17, 0,0],
    B=[1,0;
       0,1;
       1,0;
       0,1;
       1,0;
       0,1],
    C=[0,0,1,0,1,0;
       0,1,0,0,1,1],
    D=[0,0;
       0,0]));
and results in
encapsulated function polesAndZeros
  import Modelica;
  import Complex;
  import Modelica_LinearSystems2;
  import Modelica_LinearSystems2.StateSpace;
  import Modelica_LinearSystems2.Utilities.Plot;
  input StateSpace ss "Linear system in state space form" annotation(
    Dialog);
  input Boolean poles = true "= true, to plot the poles (i.e. the eigenvalues) of ss" annotation(
    choices(checkBox = true));
  input Boolean zeros = true "= true, to plot the (invariant) zeros of ss " annotation(
    choices(checkBox = true));
  input Boolean print = true "= true, to print the selection to the output window" annotation(
    choices(checkBox = true));
  extends Modelica_LinearSystems2.Internal.PartialPlotFunction(defaultDiagram = if poles and zeros then Modelica_LinearSystems2.Internal.DefaultDiagramPolesAndZeros() else if poles then Modelica_LinearSystems2.Internal.DefaultDiagramPolesAndZeros(heading = "Eigenvalues (x)") else Modelica_LinearSystems2.Internal.DefaultDiagramPolesAndZeros(heading = "Invariant zeros (o)"));
end polesAndZeros;