A Whole Body Model of the Glucose Insulin System
This model is presented in Hierarchical modeling of diabetes
by Elin Nyman, ISRN:LiU-IKE-EX-09/14. Linköping University
2009.
This whole-body model of the glucose insulin system shows the flows
and concentrations of insulin and glucose during and after a meal.
Mechanistic details on a cellular level are included in the module
describing the fat tissue. The model can be used to study diabetes
and other related diseases.
The Fat Tissue Module
The module describing the fat cells includes the main parts of the
insulin signaling network of fat cells. This process starts with
insulin molecules that bind to the insulin receptor (IR) in the
cell membrane. This activates (phosphorylates) IR. Active IR
phosphorylates the insulin receptor substrate protein 1 (IRS1)
inside the cell on selective tyrosine sites. These phosphorylations
are used as docking sites by downstream effector molecules. The
next important step in this path is the activation of protein
kinase B (PKB). PKB regulates the translocation of vesicles
including glucose transporter 4 (GLUT4) from the cytosol to the
plasma membrane. The vesicles merge into the membrane where GLUT4
starts to transport glucose from the interstitial fluid to the
inside of the cell. This signaling cascade is shown in Figure 1.
GLUT1 or glucose transporter 1 is the other glucose transporter
that exists in fat cells. GLUT1 continuously transports small
amounts of glucose into the cells for the basal needs. 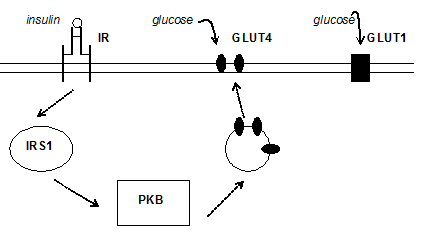
Figure 1: A simplified picture of the insulin signaling network
and the glucose uptake in fat cells.
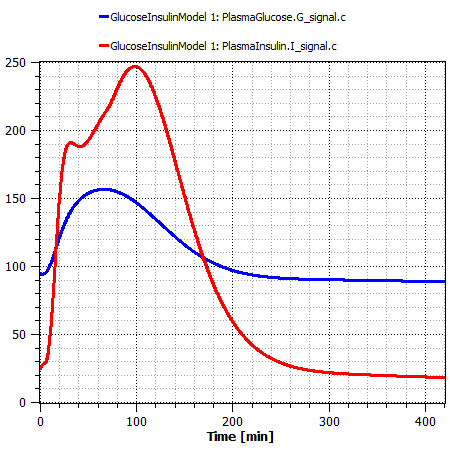
Simulations
The simulation results of the whole body level are shown in the
Figure 2, Figure 3 and
Figure 4. The concentrations of insulin and
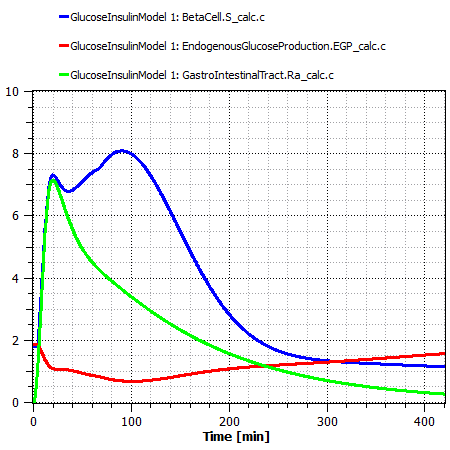
glucose are shown in Figure 2 and the three
flows: insulin from beta cells to liver, glucose from liver to
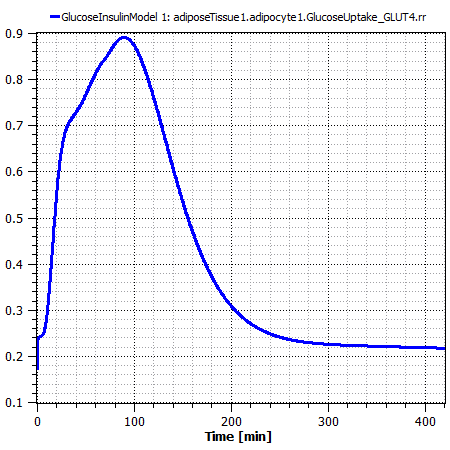
plasma, and glucose from intestine to plasma, in Figure 3. Figure 4 shows a
simulation of the glucose uptake by fat cells.
Generated at 2026-07-12T20:48:41Z by OpenModelicaOpenModelica 1.27.0 using
GenerateDoc.mos