
modelEmpirical
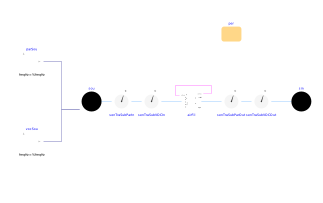
Example for using the empirical air filter model
Extends from Modelica.Icons.Example (Icon for runnable examples).
Information
The example shows a filter that captures particles and VOCs. It has different filtration efficiencies capturing the particles and VOCs.
It set up a simulation that shows the performance change of the filter in 2 years operation. The filtration efficiencies for both contaminants decrease along with the contaminant accumulation on the filtration.
When the contaminant accumulation reaches the maximum at around 412 days, the filter is replaced and the contaminants accumulated the the filter, and hence the filtration efficiencies, are reset.
Parameters
| Type | Name | Default | Description |
|---|---|---|---|
| Buildings.Fluid.AirFilters.Data.Generic | per | Performance dataset |
Components
| Type | Name | Default | Description |
|---|---|---|---|
| Buildings.Fluid.Sources.Boundary_pT | sou | Air source | |
| Buildings.Fluid.Sources.Boundary_pT | sin | Air sink | |
| Buildings.Fluid.AirFilters.Empirical | airFil | Air filter | |
| Buildings.Fluid.Sensors.TraceSubstancesTwoPort | senTraSubParIn | Trace substance sensor of CO2 in inlet air | |
| Buildings.Fluid.Sensors.TraceSubstancesTwoPort | senTraSubVOCIn | Trace substance sensor of VOC in inlet air | |
| Buildings.Fluid.Sensors.TraceSubstancesTwoPort | senTraSubParOut | Trace substance sensor of CO2 in outlet air | |
| Buildings.Fluid.Sensors.TraceSubstancesTwoPort | senTraSubVOCOut | Trace substance sensor of VOC in outlet air | |
| Buildings.Controls.OBC.CDL.Reals.Sources.Sin | parSou | Particle mass flow rate | |
| Buildings.Controls.OBC.CDL.Reals.Sources.Sin | vocSou | VOC mass flow rate |
Contents
| Name | Description |
|---|---|
 Medium Medium | Air |
Revisions
-
December 22, 2023, by Sen Huang:
First implementation.