
modelSingleZoneVAVSupply_u

Scatter plots for control signal of a single zone VAV controller from ASHRAE Guideline 36
Extends from Modelica.Icons.Example (Icon for runnable examples).

Information

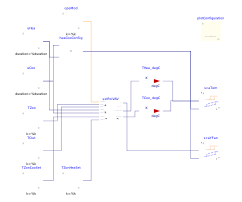
This example demonstrates how to create a scatter plot that shows for a single zone VAV control logic the heating and cooling set point temperatures, and the fan speed, all as a function of the heating and cooling control signal. The sequence that will be used to plot the sequence diagram is Buildings.Controls.OBC.ASHRAE.G36.AHUs.SingleZone.VAV.SetPoints.Supply and shown below. The plot will be generated in the file plots.html.

Image of set point reset

Components

TypeNameDefaultDescription
ConfigurationplotConfigurationPlot configuration
Buildings.Controls.OBC.CDL.Reals.SubtractheaCooConSigAdd control signal for heating (with negative sign) and cooling
Buildings.Utilities.Plotters.ScatterscaTemScatter plot for temperature setpoints
Buildings.Controls.OBC.UnitConversions.To_degCTHea_degCControl signal for heating
Buildings.Controls.OBC.UnitConversions.To_degCTCoo_degCControl signal for cooling
Buildings.Utilities.Plotters.ScatterscaYFanScatter plot for fan speed
Buildings.Controls.OBC.ASHRAE.G36.AHUs.SingleZone.VAV.SetPoints.SupplysetPoiVAVBlock that computes the setpoints for temperature and fan speed
Buildings.Controls.OBC.CDL.Reals.Sources.ConstantTZonZone air temperature
Buildings.Controls.OBC.CDL.Reals.Sources.ConstantTOutOutdoor temperature
Buildings.Controls.OBC.CDL.Reals.Sources.RampuHeaHeating control signal
Buildings.Controls.OBC.CDL.Reals.Sources.RampuCooCooling control signal
Controls.OBC.CDL.Integers.Sources.ConstantopeModAHU operation mode is occupied
Controls.OBC.CDL.Reals.Sources.ConstantTZonCooSetZone cooling set point
Controls.OBC.CDL.Reals.Sources.ConstantTZonHeaSetZone heating set point

Revisions

  • June 24, 2022, by Jianjun Hu:
    Replaced the AHU controller with the one based official release version.
  • March 23, 2018, by Michael Wetter:
    First implementation.