This information is part of the Business Simulation Library (BSL). Please support this work and ► donate.
The output y is the dimensionless degree of membership to the set of "good performances" or "good outcomes" according to a chosen type of membership function. Using the PerformanceIndicator allows to quickly grasp how a system is currently performing with regard to some criterion with a value of 1 indicating best possible performance and a value of 0 indicating worst possible (and possbily unsustainable) performance.
The following grid displays all available membership function
types without inversion (invertResults = false):
 |
| Membership Function Type | a | b | c | d |
|---|---|---|---|---|
| ramp | foot | shoulder | ||
| triangular | left foot | center | right foot | |
| trapezoidal | left foot | left shoulder | right shoulder | right foot |
| sshaped | foot | shoulder | ||
| sigmoidal | steepness of transition area | center of transition area | ||
| pishaped | left foot | left shoulder | right shoulder | right foot |
| psigmoidal | steepness of left transition | center of left transition area | steepness of right transition | center of right transition area |
| gaussian | half width at half maximum | center of curve (maximum) | ||
| bell | width of core | steepness | center of core |
When inversion is turned on (invertResult = true)
the result obtained from the membership function as specified will
be subtracted from 1. Thus the ramp shown above can be made to ramp
down from left to right with a being the shoulder and
b the foot by inverting the results.
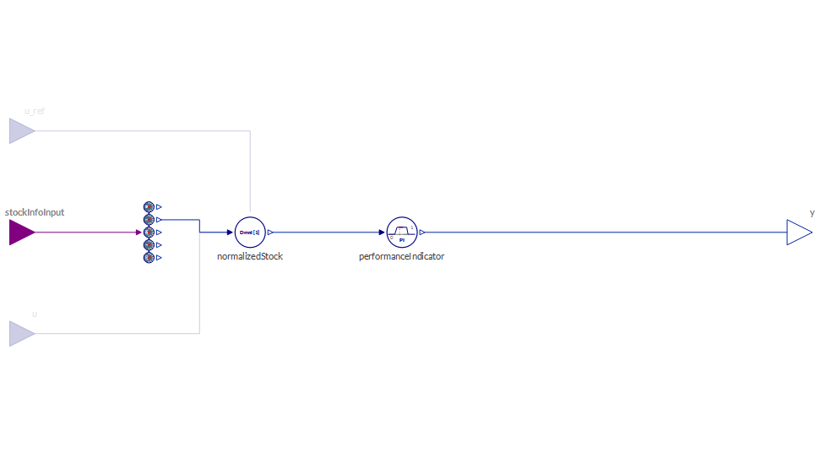 |
stockInfoInput)
will be normalized by divison either by a constant
referenceValue (default = 1) or by the exogenous input
u (hasConstantReference =
false).+,-,±) it is possible to
indicate the basic relation between the amount in the stock and its
performance value (e.g., + indicating a
"more-is-better" type of evaluation.