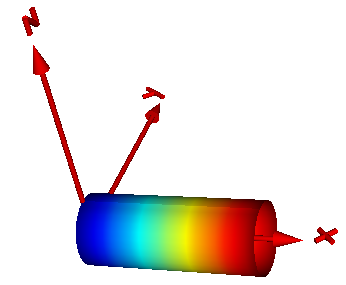
Model PipeWithScalarField visualizes a pipe and a scalar field along the pipe axis. The latter is shown by mapping scalar field to color values with a color map and utilizing this color at the perimeter associated with the corresponding axis location. Typically the scalar field value is a temperature, but might be also another quantity. Predefined color maps are available from MultiBody.Visualizers.Colors.ColorMaps and can be selected via parameter "colorMap". A color map with the corresponding scalar field values can be exported as vector-graphics in svg-format with function MultiBody.Visualizers.Colors.colorMapToSvg. The position and orientation of the center of the circle at the left end of the pipe is defined via parameters "r_0" and "R", respectively. The pipe axis is oriented along the x-axis of the local coordinate system described by "R", see figure below:
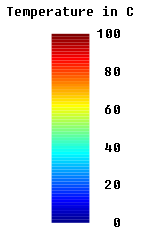
The color coding is shown in the next figure. It was generated with MultiBody.Visualizers.Colors.colorMapToSvg using the following call:
colorMapToSvg(Modelica.Mechanics.MultiBody.Visualizers.Colors.ColorMaps.jet(),
              height=50, nScalars=6, T_max=100, caption="Temperature in C");
| Name | Description |
|---|---|
|
|
Function defining the color map |