
modelCompareLineTrunks
Extends from Modelica.Icons.Example (Icon for runnable examples).
Information
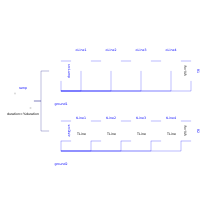
This example shows a way to look at the traveling wave moving along a power line.
This wave can be seen looking at intermediate points of the line, looking at both OLine (several segments per line trunk) and TLine models.
OLine in the lossless case is less accurate, since shows oscillations that are not present in a distributed parameter line but, since it allows the addition of resistances and conductances, allows evaluation of losses.
Suggested tests:
7 segments per trunk, lossless
Run the model as it is. Since resistances and conductances are very small in OLine, the simulation is substantially lossless.
Show in the same plot ramp.y, oLine1.p2.v, oLine2.p2.v, oLine3.p2.v, oLine4.p2.v.
Show in another plot, simultaneously, ramp.y, tLine1.p2.v, tLine2.p2.v, tLine3.p2.v, tLine4.p2.v. Here oLine shows unreal oscillations, which, however, reduce if the number of segments per trunk increases.
50 segments per trunk, lossless
Try increasing this number from 7 to 50 using parameter segsPerTrunk, and look at the same plots as per test 1
50 segments per trunk, losses
Leave segsPerTrunk=50, change r1 to 1e-3 Ω, re-simulate: the effect of losses is visible only on the oLine plot.
Parameters
| Type | Name | Default | Description |
|---|---|---|---|
| SI.Resistance | Rload | 1000 | Load resistance |
| Real | r1 | 1e-6 | Resistance per meter |
| Real | g1 | 1e-12 | Conductance per meter |
| Real | l1 | 1e-6 | Inductance per meter |
| Real | c1 | 1e-11 | Capacitance per meter |
| SI.Length | len | 100e3 | Length of line |
| Integer | segsPerTrunk | 7 | Segments per trunk |
| SI.Velocity | c | 1/sqrt(l1*c1) | Speed of EM wave |
| SI.Time | td | len/c/4 | Transmission delay |
| SI.Impedance | z0 | sqrt(l1/c1) | Characteristic impedance for very high frequency |
Components
Revisions
- May, 2021 implemented by Massimo Ceraolo, University of Pisa