ZerosAndPoles.Plot.bode(zp)
   or
ZerosAndPoles.Plot.bode(
  zp,
  nPoints,
  autoRange,
  f_min,
  f_max,
  magnitude=true,
  phase=true,
  diagram=Modelica_LinearSystems2.Internal.DefaultDiagramBodePlot(),
  device=Modelica_LinearSystems2.Utilities.Plot.Records.Device() )
This function plots the bode-diagram of a transfer function.
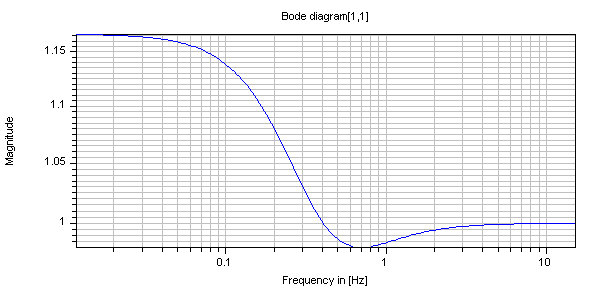
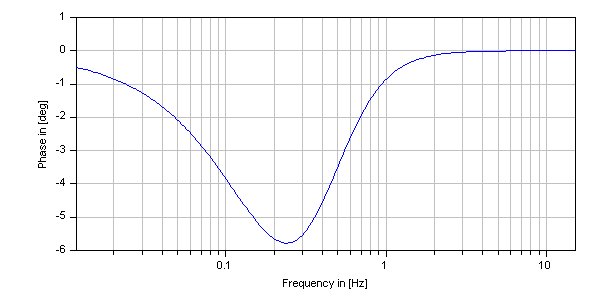
  ZerosAndPoles p = Modelica_LinearSystems2.ZerosAndPoles.p();
  Modelica_LinearSystems2.ZerosAndPoles zp =(p^2 + 5*p + 7)/(p + 2)/(p + 3);

algorithm
  Modelica_LinearSystems2.ZerosAndPoles.Plot.bode(zp)
//  gives:
encapsulated function frequencyResponsePlot
  extends Modelica.Icons.Function;
  import Modelica;
  import Modelica_LinearSystems2.Utilities.Plot;
  import Modelica.Units.SI;
  input Real f[:] "Frequency vector (either in Hz or rad/s)";
  input Real a[size(f, 1)] "Absolute value/magnitude vector (either without unit or in dB)";
  input Modelica.Units.NonSI.Angle_deg phi[size(f, 1)] "Angles in degree";
  input Boolean autoRange = true "= true, if abszissa range is automatically determined";
  input SI.Frequency f_min = 0.1 "Minimum frequency value, if autoRange = false";
  input SI.Frequency f_max = 10 "Maximum frequency value, if autoRange = false";
  input Boolean magnitude = true "= true, to plot magnitude" annotation(
    choices(checkBox = true));
  input Boolean phase = true "= true, to plot phase" annotation(
    choices(checkBox = true));
  input Boolean Hz = true "= true, to plot abszissa in [Hz], otherwise in [rad/s] (= 2*pi*Hz)" annotation(
    choices(checkBox = true));
  input Boolean dB = false "= true, to plot magnitude in [], otherwise in [dB] (=20*log10(value))" annotation(
    choices(checkBox = true),
    Dialog(enable = magnitude));
  input Plot.Records.Diagram diagram "Diagram layout" annotation(
    Dialog);
  input Plot.Records.Device device = Plot.Records.Device() "Properties of device where figure is shown" annotation(
    Dialog);
end frequencyResponsePlot;