functionplotSine
Plot a sine function in one diagram
Extends from Modelica.Icons.Function (Icon for functions).
Information
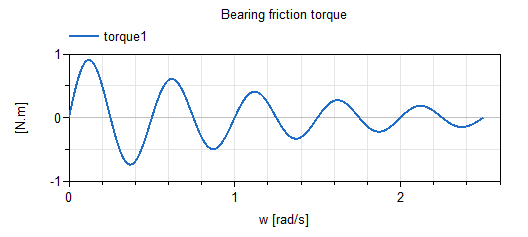
This function plots the following diagram (with default input arguments):
Inputs
| Type | Name | Default | Description |
|---|---|---|---|
| Modelica.Units.SI.Frequency | freqHz | 2 | Frequency of sine wave |
| Modelica.Units.SI.Damping | damping | 0.8 | Damping coefficient of sine wave |