This package provides functions to plot curves in two dimensions. Here is a short overview:
A figure consists of a set of diagrams. Different functions are provided to either plot one diagram (Plot.diagram) to plot several diagrams under each other (Plot.diagramVector) or to plot several diagrams in matrix layout (Plot.diagramMatrix).
Every diagram can have a set of curves. Every diagram has the same width, defined by diagramWidth. The height of a diagram is defined by variable heightRatio (diagram height in row j = diagram[j].heightRatio*diagramWidth). Several curves can be displayed in one diagram.
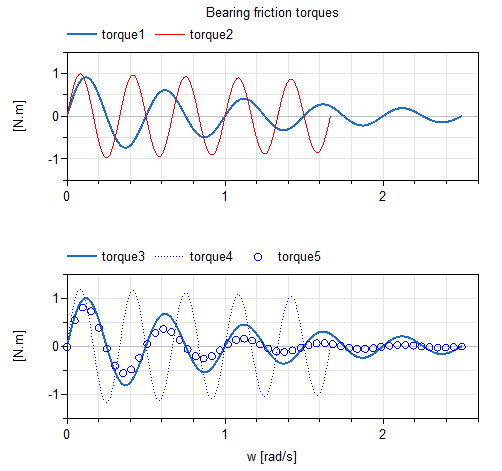
A typical example is shown in the next figure:
| Name | Description |
|---|---|
| Package of examples to demonstrate the usage of plot functions | |
| Plot one diagram | |
| Plot several diagrams in vector layout | |
| Plot several diagrams in matrix layout | |
| Plot parametrized curve with one or more branches | |
| Compute and plot the root locus of one parameter of a model (= eigen values of the model that is linearized for every parameter value) | |
| Plot amplitudes of FFT results (from result file) | |
|
|
Plot amplitudes of FFT results (from result files in existing directory) |
| Plot amplitudes of FFT results (from result files of translated model) | |
| Package of type definitions used for the plotting functions | |
| Package of library records | |
| Internal functions, that should not be utilized by a user |