This function plots the root locus of model Plot.Examples.Utilities.ControlledSISO2 over the controller gain k with a logarithmic gridding in k (the menu on the right lower part is displayed when moving the cursor on one curve point; then all points belonging to the same parameter value are marked with a red square):
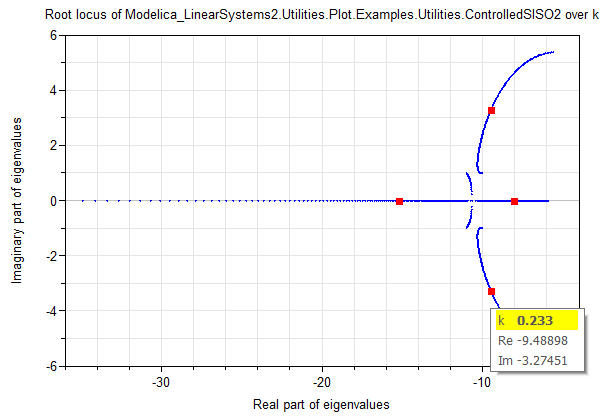
Compare this plot with the equidistant gridding in k in example rootLocusOfControlledSISO2. As can be seen, the logarithmic gridding over a controller gain yields a much better result as an equidistant gridding.
function rootLocusOfControlledSISO2Log
  extends Modelica.Icons.Function;
end rootLocusOfControlledSISO2Log;