Plot.parameterizedCurves(diagram, device)
This function plots a set of parametrized curves that depend on the same path parameter s in one window. The set of parameterized curves is defined by:
   s = s[i]   // Vector of s-values
   X = X[j,i] // X=X(s), where s[i] is the s-value and j is the s-branch of the x-value
   Y = Y[j,i] // Y=Y(s), where s[i] is the s-value and j is the s-branch of the y-value
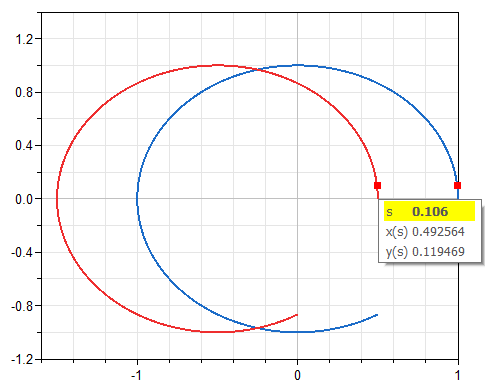
Execute function Examples.plotParameterizedCurve1 that is defined as parameterized sine and cosine-functions:
s = linspace(0, Modelica.Units.Conversions.from_deg(300), 100);
for i in 1:nPoints loop
  X[1, i] := cos(s[i]);
  Y[1, i] := sin(s[i]);
  X[2, i] := X[1, i] - 0.5;
  Y[2, i] := Y[1, i];
end for;
Plot.parameterizedCurves(diagram=
  Plot.Records.ParametrizedCurves(
    X=X,
    Y=Y,
    s=s));
This yields the following diagram (the menu on the right lower part is displayed when moving the cursor on one curve point; then all points belonging to the same path parameter value are marked with a red square):
function parameterizedCurves
  extends Modelica.Icons.Function;
  import Modelica_LinearSystems2;
  import Modelica_LinearSystems2.Utilities.Plot.Internal;
  input Modelica_LinearSystems2.Utilities.Plot.Records.ParametrizedCurves diagram "Parametrized curve data points" annotation(
    Dialog);
  input Modelica_LinearSystems2.Utilities.Plot.Records.Device device = Modelica_LinearSystems2.Utilities.Plot.Records.Device() "Properties of device where figure is shown" annotation(
    Dialog);
end parameterizedCurves;