
functionrootLocusOfModel
Compute and plot the root locus of one parameter of a model (= eigen values of the model that is linearized for every parameter value)
Extends from Modelica.Icons.Function (Icon for functions).
Information
Syntax
Plot.rootLocusOfModel(modelName, modelParam, simulationSetup, diagram, device)
Description
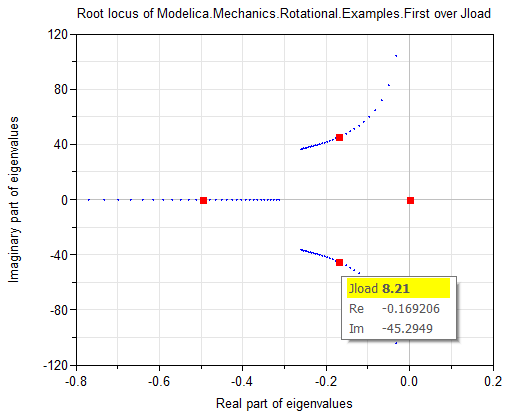
This function computes and plots a root locus of a selected Modelica model by varying one parameter and performing an eigen value analysis for every parameter value. Other parameters of the model can be set to a specific value. An equidistant or a logarithmic gridding of the parameter to be varied can be selected and then the gridding is performed between the given minimum and maximum value.
Example
Calling the function
Utilities.Plot.rootLocusOfModel(
  modelName = "Modelica.Mechanics.Rotational.Examples.First",
  modelParam={
    Modelica_LinearSystems2.Records.ParameterVariation(
      Name="Jload",
      grid=Modelica_LinearSystems2.Types.Grid.Logarithmic
      Min=1,
      Max=6,
      nPoints=101)});
yields the following diagram (the menu on the right lower part is displayed when moving the cursor on one curve point; then all points belonging to the same parameter value are marked with a red square):
Inputs
| Type | Name | Default | Description |
|---|---|---|---|
| String | modelName | Name of the Modelica model | |
| Modelica_LinearSystems2.Records.ParameterVariation[:] | modelParam | Model parameter to be varied (exactly one) and values for other parameters | |
| Modelica_LinearSystems2.Records.SimulationOptionsForLinearization | simulationSetup | Modelica_LinearSystems2.Records.SimulationOptionsForLinearization() | Simulation options |
| Modelica_LinearSystems2.Utilities.Plot.Records.RootLocusDiagram | diagram | Modelica_LinearSystems2.Utilities.Plot.Records.RootLocusDiagram() | |
| Modelica_LinearSystems2.Utilities.Plot.Records.Device | device | Modelica_LinearSystems2.Utilities.Plot.Records.Device() | Properties of device where figure is shown |