modelWithinRelativeDomain

Extends from Internal.PartialFFT (Partial model containing the common part of the FFT blocks).
Information
Syntax
property = WithinRelativeFFTdomain(condition=..., u=..., f_max=..., f_resolution=..., f_base=...., maxAmplitude=...).y;
Description
Whenever the Boolean input condition has a rising edge, the Real input u is sampled and stored in a buffer. Once enough values of u are stored in the buffer (depending on parameters f_max and f_resolution) a Fast Fourier Transform (FFT) of the buffer u-values is computed. The amplitudes and frequencies of the computed FFT are stored on file and displayed in the icon. The amplitudes must be below the polygon defined by parameter maxAmplitude (maxAmplitude[fi,Ai] defines the maximum amplitude Ai in [% of amplitude at base frequency] at frequency point fi in [Hz]. fi ≥ 0 required). The amplitude of the base frequency is defined to be the largest amplitude of the computed FFT around the frequency:
f_base - df ≤ f ≤ f_base + df
and the frequency difference df is computed from the advanced parameter
searchInterfal (default = 5 %) as:
df = f_base*searchInterval/100
The check is performed in the range: 0 ≤ f ≤ min(f_max, maxAmplitude[end,1]) and the maxAmplitude values are linearly interpolated for this check.
For more details, see the description of package ChecksInFixedWindow_withFFT.
Example
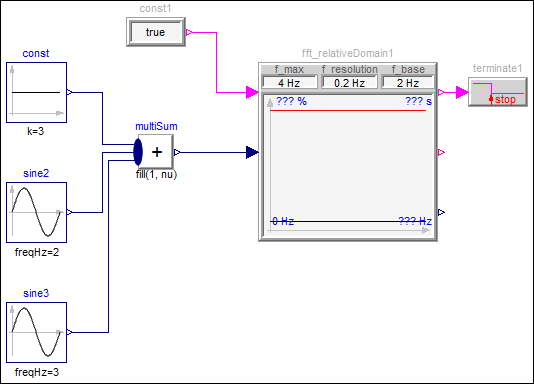
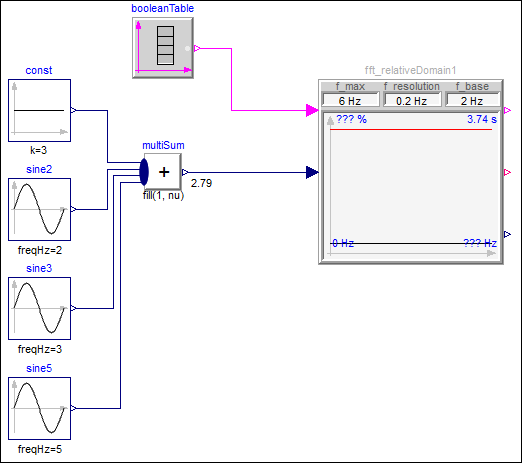
This block is demonstrated with the following first example:
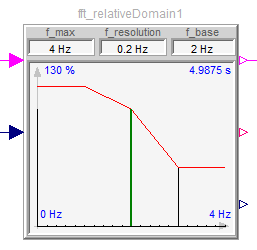
The amplitutes of the FFT are dynamically displayed in the icon of the block (in black), as well as the maximume amplitudes maxAmplitude (in red). The computed amplitude of the base frequency is shown in green (so this amplitude is 100 %)
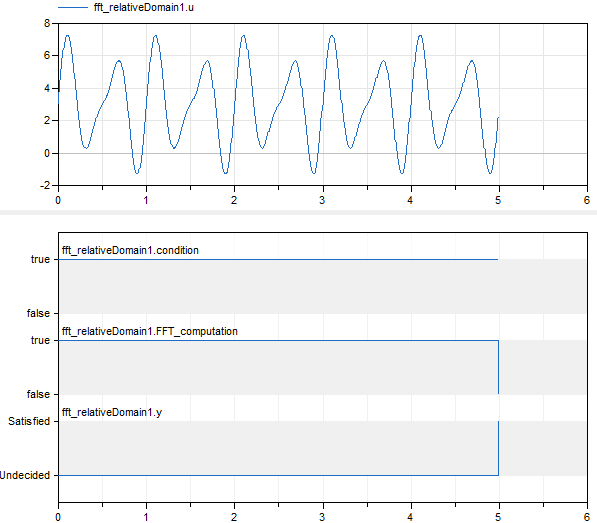
Simulating this examples results in
 |
|
| simulation result |
As can be seen, the simulation is terminate (via instance terminate1 of block FallingEdgeTerminate) once the FFT has been computed (signaled via the falling edge of FFT_computation). Since all FFT amplitudes between 0 ≤ f ≤ min(f_max, maxAmplitude[end,1]) are below the maximally allowed limit, the block returns Property.Satisfied.
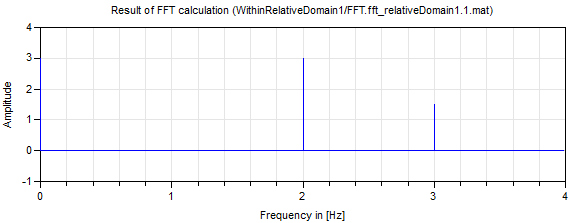
A plot of the FFT result file is shown in the next figure:
This block can be also used to compute several FFTs along a simulation as demonstrated with the following second example:
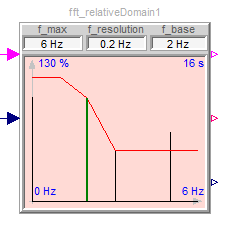
The amplitutes of the FFT are dynamically displayed in the icon of the block (in black), as well as the maximume amplitudes maxAmplitude (in red). At the end of the simulation, one of the amplitudes is larger as allowed:
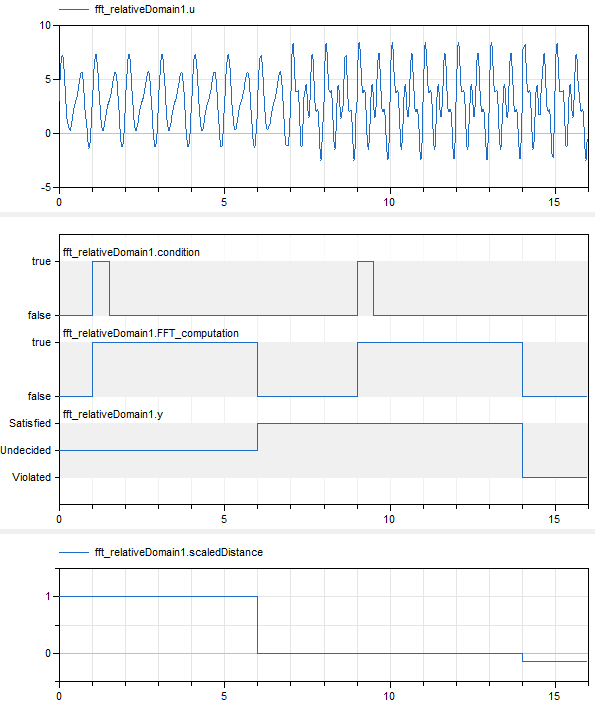
Simulating this examples results in
 |
|
| simulation result |
As can be seen, the first FFT fulfills the check (scaledDistance = 0), whereas the second FFT has amplitudes that are larger as allowed (scaledDistance = -0.1).
Parameters
| Type | Name | Default | Description |
|---|---|---|---|
| Boolean | storeFFTonFile (from PartialFFT) | true | = true, if FFT results shall be stored on file <modelName>/FFT.<instanceName>.<index>.mat |
| Modelica.Units.SI.Frequency | f_max (from PartialFFT) | Maximum frequency of interest (sampling frequency >= 10*f_max) | |
| Modelica.Units.SI.Frequency | f_resolution (from PartialFFT) | Frequency resolution (frequency axis points are an integer multiple of f_resolution) | |
| Integer | ns (from PartialFFT) | Internal.get_ns(f_max, f_resolution) | Number of FFT sample points (is even and can be expressed as ns = 2^i*3^j*5^k) |
| Modelica.Units.SI.Frequency | f_max_FFT (from PartialFFT) | f_resolution*div(ns, 2) | Maximum frequency used by FFT |
| Integer | nf (from PartialFFT) | div(ns, 2) + 1 | Number of frequency points |
| Modelica.Units.SI.Time | Ts (from PartialFFT) | 1/(2*f_max_FFT) | Sample period |
| Modelica.Units.SI.Time | T (from PartialFFT) | (ns - 1)*Ts | Simulation time for one FFT calculation |
| Integer | np (from PartialFFT) | max(1, min(integer(ceil(f_max/f_resolution)) + 1, nf)) | Number of frequency points used for plotting (only up to interested frequency |
| Modelica.Units.SI.Frequency | f_max_plot (from PartialFFT) | (np - 1)*f_resolution | |
| Modelica.Units.SI.Frequency | f_base | Base frequency (100 % amplitude = largest amplitude around f_base) | |
| Real[:,2] | maxAmplitude | Maximum allowed amplitude: Real[:,2] array with [frequency in Hz, amplitude[%]] | |
| Advanced | |||
| Real | searchInterval | 5 | Search interval [%] around base frequency f_base for real base frequency (with largest amplitude) |
Connectors
| Type | Name | Default | Description |
|---|---|---|---|
| Modelica.Blocks.Interfaces.BooleanInput | condition (from PartialFFT) | Boolean input condition signal (a rising edge signals to store u-values in a buffer; if there are enough values in the buffer, an FFT is computed) | |
| Modelica.Blocks.Interfaces.RealInput | u (from PartialFFT) | Signal on which an FFT is performed | |
| Modelica_Requirements.Interfaces.PropertyOutput | y (from PartialFFT) | Property output signal (= Satisfied, if FFT Amplitudes of u are within maxAmplitude) | |
| Modelica.Blocks.Interfaces.BooleanOutput | FFT_computation (from PartialFFT) | = true, when u is stored in buffer for FFT computation | |
| Modelica.Blocks.Interfaces.RealOutput | scaledDistance (from PartialFFT) | Minimum distance of FFT Amplitudes of u to maxAmplitude (>= 0 if inside, otherwise outside of maxAmplitude) |
Components
| Type | Name | Default | Description |
|---|---|---|---|
| Boolean | periods_ok (from PartialFFT) | = true, if all periods for FFT computations have been long enough | |
| Integer[3] | fillColor (from PartialFFT) | if scaledDistance >= 0 then {245, 245, 245} else {255, 218, 213} | |
| Real[3*np,2] | fA_plot (from PartialFFT) | [frequency, amplitude] matrix used for plotting in icon | |
| Modelica.Units.SI.Frequency | f_base2 | Real base frequency (frequency with largest amplitude around f_base) | |
| Real | A_base2 | Amplitude at the real base frequency (= largest amplitude around f_base) | |
| Real[2,2] | f_base2_line | ||
| Real | A_max_plot | ||
| Real | A_max_plot_perCent | ||
| Real[size(maxAmplitude, 1),2] | maxAmplitude2 | Maximum allowed amplitude: Real[:,2] array with [frequency in Hz, amplitude] | |
| Real[size(maxAmplitude, 1),2] | maxAmplitudePlot |
Revisions
| Date | Description |
|---|---|
| Nov. 29, 2015 |
Initial version implemented by
Martin R. Kuhn and Martin Otter
(DLR Institute of System Dynamics and Control) The research leading to these results has received funding from the European Union’s Seventh Framework Programme (FP7/2007-2016) for the Clean Sky Joint Technology Initiative under grant agreement no. CSJU-GAM-SGO-2008-001. |