modelXYPlotWithImage
XY-plot with background image
Information
XY-plot with an image as background. The plot is visualized in the tools diagram view.
Special case
If the x and y vector contains only one data point a circle will be visualized instead of the polyline.
Coordinate transformation
The coordinate system of the diagram is built up by defining (x,y) values at two positions in the image, point_1 and point_2. For point_1 and point_2 the corresponding image pixel coordinates, point_1_imagePixelCoord and point_2_imagePixelCoord needs to be defined.
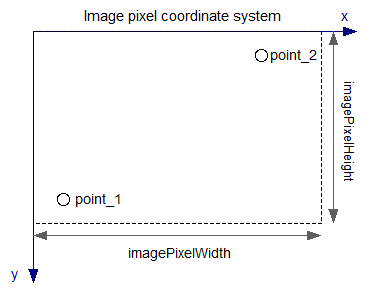
Image pixel dimension and coordinates of the specified image can be found by using an image program such as Paint.
Parameters
| Type | Name | Default | Description |
|---|---|---|---|
| Boolean | circle_1_visible | if size(x, 1) == 1 then true else false | |
| Image | |||
| String | imageName | "" | Image name |
| Coordinate transformation | |||
| Real[2] | point_1 | {0, 0} | x,y value of point 1 |
| Real[2] | point_2 | {1, 1} | x,y value of point 2 |
| Real[2] | point_1_imagePixelCoord | {0, 500} | Image pixel coordinate at point 1 |
| Real[2] | point_2_imagePixelCoord | {1000, 0} | Image pixel coordinate at point 2 |
| Real | imagePixelWidth | 1000 | Image pixel width |
| Real | imagePixelHeight | 500 | Image pixel height |
| Diagram attributes | |||
| Integer | color | {0, 0, 255} | Color (RGB) for line 1 |
Components
| Type | Name | Default | Description |
|---|---|---|---|
| Real[:] | x | {(point_1[1] + point_2[1])/2} | x-axis values |
| Real[size(x, 1)] | y | {(point_1[2] + point_2[2])/2} | y-axis values |
| Real | points_line | ||
| Real | points_circle |