References:
Simulate the model six times across 200 years while keeping all
six trajectories (plot setup menu). For the six simulation runs,
choose different levels of resource utilization after the year
1970:
NRUN2 = {0.25, 0.5, 0.75, 1.0, 1.25,
1.5}.
Compute a performance index:
Perf_Index = min_QL +
5*min_dPop;
where min_QL is the minimal quality of life observed between
2000 and 2100, and min_dPop is the largest negative
population gradient observed in the same time period.
Plot the performance index across the calendar years between 2000 and 2100 for all six scenarios on a single graph:
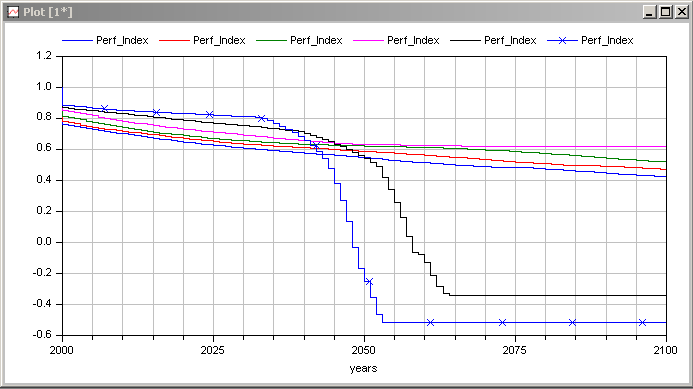
NRUN2 = 0.25 and NRUN2 = 0.5 lead to massive die-off, whereas the other scenarios avoid this problem. However in the short run, those scenarios that offer the worst long-term performance are characterized by the best short-term performance. This is the predicament that humanity is currently facing.