modelPipeWithScalarField
Visualizing a pipe with scalar field quantities along the pipe axis
Extends from Modelica.Mechanics.MultiBody.Interfaces.PartialVisualizer (Base model for visualizers (has a frame_a on the left side + outer world + assert to guarantee that the component is connected)).
Information
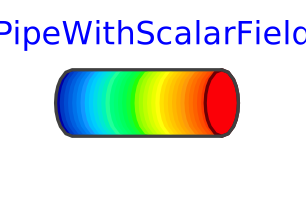
Model PipeWithScalarField visualizes a pipe and a scalar
field along the pipe axis. The latter is shown by mapping the scalar
field to color values with a color map and utilizing this color
at the perimeter associated with the corresponding axis location.
Typically the scalar field value is a temperature, but might
be also another quantity.
Predefined color maps are available from
MultiBody.Visualizers.Colors.ColorMaps
and can be selected via parameter "colorMap".
A color map with the corresponding scalar field values can be exported
as vector-graphics in svg-format with function
MultiBody.Visualizers.Colors.colorMapToSvg.
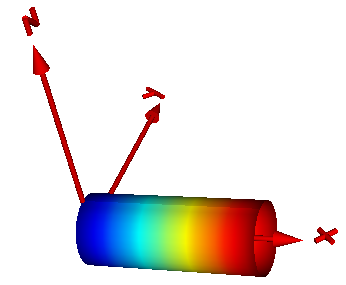
Connector frame_a of this component is located in the center of the
circle at the left side of the pipe and the pipe axis is oriented
along the x-axis of frame_a, see figure below in which frame_a is visualized
with a coordinate system:
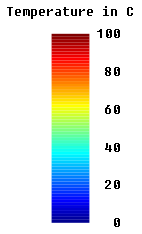
The color coding is shown in the next figure. It was generated with
MultiBody.Visualizers.Colors.colorMapToSvg
using the following call:
colorMapToSvg(Modelica.Mechanics.MultiBody.Visualizers.Colors.ColorMaps.jet(),
              height=50, nScalars=6, T_max=100, caption="Temperature in C");
Parameters
| Type | Name | Default | Description |
|---|
| Boolean | animation | true | = true, if animation shall be enabled |
| SI.Radius | rOuter | | Outer radius of pipe |
| SI.Length | length | | Length of pipe |
| Real[:] | xsi | Modelica.Math.Vectors.relNodePositions(12) | Vector of relative positions along the pipe with x[1] = 0, x[end] = 1 |
| Real | T_min | | Minimum value of T that corresponds to colorMap[1,:] |
| Real | T_max | | Maximum value of T that corresponds to colorMap[end,:] |
| Color coding |
| Integer | n_colors | 64 | Number of colors in the colorMap |
| Types.SpecularCoefficient | specularCoefficient | 0.7 | Reflection of ambient light (= 0: light is completely absorbed) |
| Real | transparency | 0 | Transparency of shape: 0 (= opaque) ... 1 (= fully transparent) |
| Discretization |
| Integer | n_rOuter | 30 | Number of points along outer radius |
| Integer | n_length | 20 | Number of points along length |
Components
| Type | Name | Default | Description |
|---|
| Real[size(xsi, 1)] | T | | Vector of values at positions xsi*length (will be visualized by color) |
Contents
| Name | Description |
|---|
 colorMap colorMap | |
Revisions
- July 2010 by Martin Otter
Adapted to the new Surface model.
- July 2005 by Dirk Zimmer (practical training at DLR)
First version to visualize a multi-level tyre wheel model.